
ClickHouseLaunch

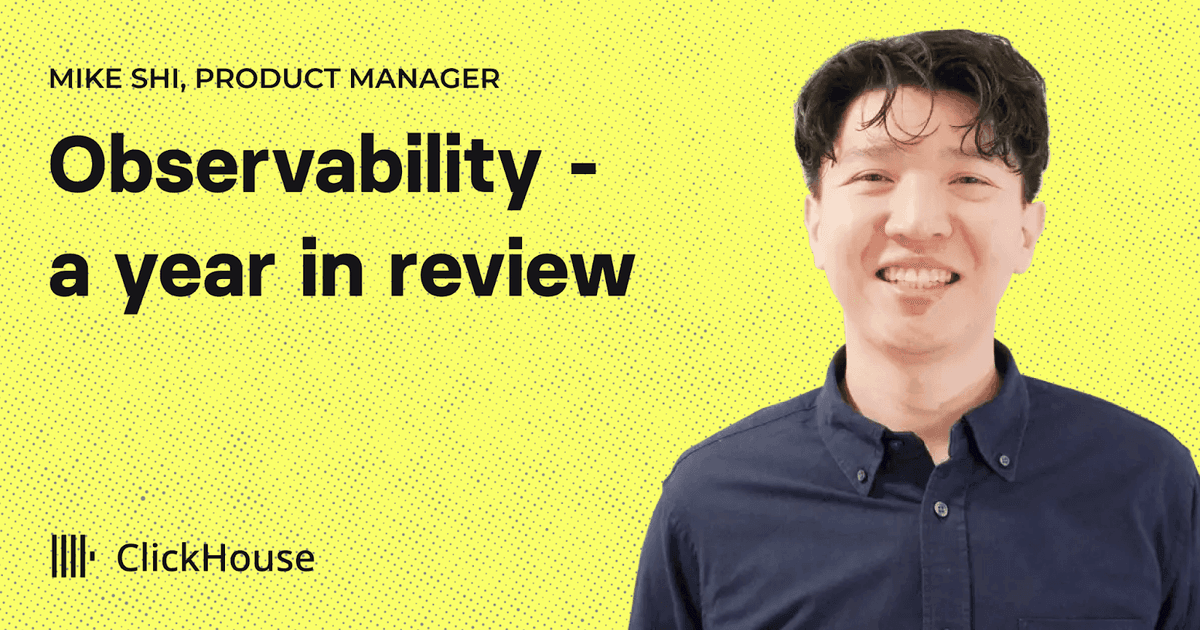
Observability - a year in review
What happened

ClickHouse launched ClickStack on May 1st '25.

Source

clickhouse.comJan 7, 2026

Observability - a year in review

Article excerpt

Highlighted: the sentence this signal was extracted from

Observability - a year in review. With the start of the new year, it feels like the right moment to pause and reflect on a year that was pivotal for observability at ClickHouse and for me personally. As Head of Product Management for Observability, my focus throughout 2025 was building ClickStack and working closely with customers, partners, and the broader community to rethink what scalable observability should look like. In May 2025, ClickHouse introduced ClickStack with a simple goal: make high-performance observability on ClickHouse accessible to everyone. Until then, teams either built their own user interfaces on top of ClickHouse or relied on more generic visualization tools like Grafana. By pairing ClickHouse with the HyperDX UI, ClickStack removes that friction and allows teams to immediately benefit from ClickHouse's compression and fast query execution optimized for logs, traces, and metrics. For a detailed reflection on what 2025 looked like for ClickStack itself, see its earlier blog. Here, I want to focus instead on a few broader observations about how the observability landscape shifted over the past year, shaped by my conversations with its users, time spent at conferences, and ongoing discussions across the observability community. Learn about ClickStack. Explore the ClickHouse-powered open source observability stack built for OpenTelemetry at...

Keep reading with a free account

The rest of this article, and every signal for ClickHouse, is in your free account.

Extracted by Autobound

From the Signal API record
Event
Launch

What this signalsA launch often needs new go-to-market and support spend.

Product
ClickStack
Takes effect
May 1, 2025

The full record

From the Signal API record

Details

Category
Launches

Extraction

Confidence
75%
Detected
Oct 7, 2025
signal_type
news
signal_subtype
launches

Use this data

Get every launch signal for ClickHouse and the companies you sell to, in the tools you already use.

  1. Ask Claude about it

    Connect Autobound to Claude, Claude Code or Cursor with MCP. Then ask: “What changed at ClickHouse this week?”

  2. Send it to your own tools

    The Signal API returns launch signals for any list of companies as JSON, for your CRM, warehouse or app.

  3. Try it free

    Sign up and spend your free credits on the companies you sell to.

    Start Free1,000 free credits

The API returns more than this page shows

This page shows a preview. The full news record in the Signal API and MCP can also have these 8 fields. Some fields are empty for some signals.

Company

  • linkedin_urlValue in the API
  • industriesValue in the API
  • employee_count_lowValue in the API
  • employee_count_highValue in the API
  • revenueValue in the API
  • descriptionValue in the API

Signal

  • signal_nameValue in the API
  • associationValue in the API
Show the full JSONThe record on this page and the API request

GET /v1/signals/cba9270d-e599-46fb-8a83-9ca228340388 returns this record as JSON. POST /v1/companies/enrich returns every signal for clickhouse.com.

{
  "signal_id": "cba9270d-e599-46fb-8a83-9ca228340388",
  "signal_type": "news",
  "signal_subtype": "launches",
  "detected_at": "2025-10-07T13:00:27+00:00",
  "company": {
    "name": "ClickHouse",
    "domain": "clickhouse.com"
  },
  "data": {
    "url": "https://clickhouse.com/blog/observability-a-year-in-review",
    "title": "Observability - a year in review",
    "excerpt": "Observability - a year in review.\n\nWith the start of the new year, it feels like the right moment to pause and reflect on a year that was pivotal for observability at ClickHouse and for me personally. As Head of Product Management for Observability, my focus throughout 2025 was building ClickStack and working closely with customers, partners, and the broader community to rethink what scalable observability should look like.\n\nIn May 2025, ClickHouse introduced ClickStack with a simple goal: make high-performance observability on ClickHouse accessible to everyone. Until then, teams either built their own user interfaces on top of ClickHouse or relied on more generic visualization tools like Grafana. By pairing ClickHouse with the HyperDX UI, ClickStack removes that friction and allows teams to immediately benefit from ClickHouse's compression and fast query execution optimized for logs, traces, and metrics.\n\nFor a detailed reflection on what 2025 looked like for ClickStack itself, see its earlier blog.\n\nHere, I want to focus instead on a few broader observations about how the observability landscape shifted over the past year, shaped by my conversations with its users, time spent at conferences, and ongoing discussions across the observability community.\n\nLearn about ClickStack.\n\nExplore the ClickHouse-powered open source observability stack built for OpenTelemetry at...",
    "product": "ClickStack",
    "summary": "ClickHouse launched ClickStack on May 1st '25.",
    "category": "launches",
    "found_at": "2025-10-07T13:00:27Z",
    "planning": false,
    "image_url": "https://clickhouse.com/_next/image?url=%2Fuploads%2Fo11y_year_in_review_2757187123.png&w=1200&h=630&q=80",
    "confidence": 0.7463,
    "product_data": {
      "full_text": "ClickStack",
      "fuzzy_match": true
    },
    "published_at": "2026-01-07T00:00:00Z",
    "effective_date": "2025-05-01",
    "article_sentence": "In May 2025, ClickHouse introduced ClickStack with a simple goal: make high-performance observability on ClickHouse accessible to everyone."
  }
}

Long text fields are shortened on this page.

Looking up one signal by its id is free. Enrich costs 2 credits per signal returned; a call with no results is free.